EV Charging Stations by State: 2026 Ranking of All 50 States
California leads with 67,204 public EV charging ports, but Hawaii and New Jersey have the most EVs per charger. All 50 states and DC, ranked for 2026.
EWEVS Worldwide14 September 2026 · 15 min read · Market Intelligence
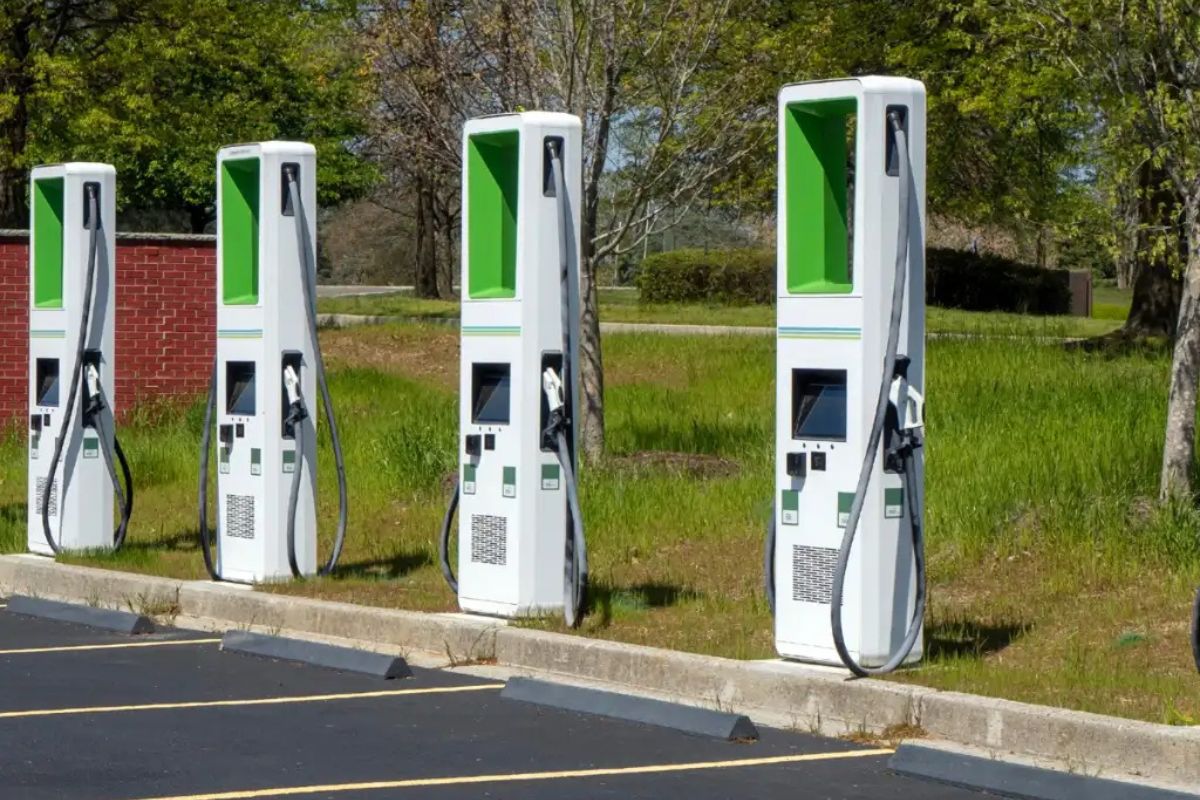
The United States has 256,643 public EV charging ports at 81,723 station locations, according to the Department of Energy's Alternative Fuels Data Center as of 14 September 2026. California has by far the most: 67,204 ports, more than New York, Florida and Texas combined. But the state with the most chargers is not the state where a charger is easiest to find. Measured against the cars that need them, Hawaii and New Jersey are the most stretched in the country, and Wyoming and North Dakota the least.
This ranking covers every state and the District of Columbia on four measures: public charging ports, plug-in electric vehicles registered, EVs per 1,000 residents, and EVs per public port. Every figure comes from federal data, and the full table is below.
Key numbers for 2026
256,643 public charging ports nationwide: 180,047 Level 2, 75,884 DC fast and 700 Level 1. DC fast charging is 29.6% of all public ports.
7,454,800 plug-in vehicles registered in 2025: 5,689,100 battery-electric and 1,765,700 plug-in hybrids, up 23.7% on 2024.
29 plug-in vehicles for every public port on average, and 21.8 plug-ins for every 1,000 Americans.
California leads on ports (67,204), plug-in vehicles (2,334,000) and EVs per person (59.3 per 1,000 residents).
Alaska has the fewest public ports (206), and Mississippi the fewest plug-in vehicles per resident (3.5 per 1,000).
California's 67,204 ports are 26% of the national total. New York is second with 21,657, followed by Florida (15,018), Texas (12,626) and Massachusetts (11,734). Washington, Colorado, Georgia, New Jersey and Illinois complete the top 10, and together those ten states hold 64% of every public port in the country.
The order changes when you count only DC fast chargers, the high-power units that add hundreds of miles in under an hour and matter most for road trips and ride-hailing drivers:
DC fast charging ports by state, top 10
ports
Texas moves from fourth to second on fast charging, with 5,353 DC fast ports, and Florida to third. New York falls to fourth: about 84% of its public ports are Level 2 or Level 1 chargers. At the other end, fast charging dominates the networks of several rural states, where chargers are built along highway corridors rather than in towns. DC fast ports are 58.2% of all public ports in Oklahoma, 54.1% in Montana and 52.3% in Alabama.
Which state has the most electric cars?
California again, by a very wide margin. It had 2,334,000 plug-in vehicles registered in 2025, about 31% of the national fleet. The rest of the top 10:
Counting battery-electric cars only, the order barely changes: California has 1,843,100, Florida 450,400 and Texas 387,400. One exception is New York, which falls from fourth to sixth, because a larger share of its plug-in fleet is plug-in hybrids.
These are registrations, not sales. They count every plug-in vehicle registered in the state during the year, new and used, which is why they are the better guide to how many cars are actually on the road.
Electric cars per capita: where EVs are most common
Raw totals favour big states. Per resident, the map looks different:
California still leads with 59.3 plug-in vehicles per 1,000 people, nearly three times the national average of 21.8. Washington (36.7) and Colorado (36.6) are close behind, followed by Oregon, Hawaii and Nevada. Vermont, with 30.4 per 1,000, is the standout among small states: it ranks seventh, ahead of New Jersey (28.5) and Maryland (25.9).
The lowest adoption is concentrated in the South and the northern Plains: Mississippi (3.5), North Dakota (3.8), West Virginia (4.4), Wyoming (5.3) and Arkansas (5.5). In those states fewer than one resident in 180 has a plug-in vehicle.
Which states have the most chargers per electric car?
Dividing registered plug-in vehicles by public ports shows how much pressure each network is under. A lower number means more public charging for each car.
Most stretched (most plug-in EVs per public port):
Hawaii: 40.8
New Jersey: 40.8
Nevada: 37.5
Arizona: 37.3
Texas: 37.0
Oklahoma: 36.4
Florida: 35.9
Best served (fewest plug-in EVs per public port):
Wyoming: 9.4
North Dakota: 10.8
Maine: 13.9
West Virginia: 14.2
Vermont: 14.6
Massachusetts: 14.8
New York: 15.4
Read the "best served" list carefully. Wyoming and North Dakota do not have dense charging; they have very small EV fleets and a handful of highway corridor chargers, so each port has few cars to share it. Massachusetts and New York are the more meaningful result: large fleets, and still around 15 cars per port. Both networks are built mostly on Level 2 charging, with only about one public port in six a DC fast charger.
The stretched states tell the opposite story. Hawaii, New Jersey, Nevada, Arizona, Texas and Florida all have large fleets relative to their public networks, with 36 to 41 plug-in vehicles competing for each port. Drivers who cannot charge at home feel that pressure first.
The fastest-growing states for electric cars
Nationally, battery-electric registrations rose 26.3% between 2024 and 2025, and plug-in hybrids 16.1%. Growth was fastest in states that started from a lower base:
State
Battery-electric vehicles 2024
2025
Growth
Michigan
75,800
112,600
48.5%
Delaware
11,100
16,000
44.1%
Alabama
17,500
24,400
39.4%
Kentucky
15,000
20,700
38.0%
Source: AFDC vehicle registration counts, 2024 and 2025.
Michigan stands out because of its size: it added 36,800 battery-electric cars in a year. The slowest growth was in Vermont (16.7%), Hawaii (17.4%), Rhode Island (18.1%), Oklahoma (18.6%) and California (20.2%) — though California still added more battery-electric cars than any other state.
Two cautions. AFDC rounds every count to the nearest 100, so growth rates for very small fleets, such as North Dakota's, move several points on rounding alone. And Louisiana's apparent near-doubling coincides with a large jump in its hybrid count, which points to a change in how vehicles were classified rather than a real sales surge, so we have left it out of the headline list.
Full table: EV charging stations and electric cars in all 50 states
Ranked by public charging ports. Ports = public charging ports; Plug-in EVs = battery-electric and plug-in hybrid vehicles registered in 2025; Per port = plug-in EVs per public port; Per 1,000 = plug-in EVs per 1,000 residents. Click a state to open its EV service market report.
Sources: public ports and DC fast ports from the AFDC station counts by state, 14 September 2026; plug-in EVs (battery-electric plus plug-in hybrid) from AFDC vehicle registrations, 2025; population from the US Census Bureau, Vintage 2025. Ratios calculated by EVS Worldwide.
How the US charging network is changing
The count of all non-residential charging ports, public and private, rose from 229,320 in December 2024 to 271,488 in December 2025, an 18.4% increase, according to AFDC's historical station counts. DC fast ports grew fastest, by 33.5%, from 51,393 to 68,599. (Those December figures include private ports, so they are not directly comparable with the public-only 256,643 counted today.)
Three forces will shape the next two years:
Federal highway charging money is moving again. The National Electric Vehicle Infrastructure (NEVI) programme, run by the Federal Highway Administration with the Joint Office of Energy and Transportation, operates under interim final guidance issued in August 2025, and states including New York and Kansas reopened NEVI funding rounds in 2026.
The Tesla-style connector is becoming standard. The SAE J3400 connector, based on Tesla's North American Charging Standard, is now an SAE Recommended Practice. The Joint Office requires federally funded DC fast chargers to offer CCS1 connectors and allows J3400 connectors alongside them, so new sites increasingly serve both.
Sales have cooled, but the fleet keeps growing. The IEA's Global EV Outlook 2026 puts US electric-car sales in 2025 at around 1.5 million, slightly below 2024, after federal EV tax credits ended for vehicles acquired after September 2025. Every one of those cars joins the registered fleet, so charging demand, and the work of keeping those cars running, rises every year regardless.
What the ranking means for EV service businesses
Chargers follow policy and investment. Service demand follows the cars. For anyone planning an EV workshop, a franchise or a fleet service operation, the registration numbers matter more than the port counts.
Fleet size sets the ceiling. California, Florida, Texas, New York, Washington and New Jersey each have more than 250,000 plug-in vehicles, and those fleets are ageing out of warranty every year. Our United States EV market report and the state-by-state reports model that demand in detail.
Growth states are where the next workshops will be needed. Michigan (plug-in fleet up 41.4% in 2025), Florida (33.0%) and Georgia (32.6%) combine large fleets with fast growth. That is the opportunity an EV service franchise is built for, and what a specialist EV workshop needs to serve it.
Stretched networks mean more high-power charging, and more battery questions. In states that rely heavily on DC fast charging, owners and fleet managers ask more about battery wear, which is why independent battery state-of-health checks are becoming a standard service.
Commercial fleets need uptime, not just chargers. Businesses running EVs in these states care about how quickly a vehicle returns to the road; see our fleet EV uptime playbook.
Methodology and definitions
Charging ports, not connectors. The AFDC defines a charging port as one that charges one vehicle at a time, even if it has several connectors, and a station location as a physical site with one or more ports. We rank by ports. Counts include legacy chargers and exclude home charging.
Registrations are the 2025 fleet. AFDC registration counts are derived from Experian data by the National Laboratory of the Rockies, rounded to the nearest 100, and describe vehicles registered through 2025. Station counts are live as of 14 September 2026, so ratios compare this year's network with last year's fleet.
Plug-in EVs means battery-electric plus plug-in hybrid vehicles, the definition used across our US market reports.
State reports. For ten states our individual market reports use other published vehicle figures, such as state-agency counts, so their numbers can differ slightly from this AFDC-based national comparison.
The District of Columbia is included in the table and the rankings.
Frequently asked questions
Which state has the most EV charging stations?
California, with 67,204 public charging ports at its station locations as of September 2026. That is about 26% of all public ports in the United States. New York is second with 21,657 and Florida third with 15,018.
How many EV charging stations are there in the US in 2026?
The AFDC counts 81,723 public charging station locations with 256,643 charging ports as of 14 September 2026. Of those ports, 75,884 are DC fast chargers and 180,047 are Level 2.
Which state has the most electric cars?
California had 2,334,000 plug-in vehicles registered in 2025, including 1,843,100 battery-electric cars. Florida (538,800 plug-ins) and Texas (467,300) are second and third.
Which state has the most electric cars per capita?
California, with 59.3 plug-in vehicles per 1,000 residents. Washington (36.7) and Colorado (36.6) follow. The national average is 21.8 per 1,000.
Which states have the fewest EV chargers?
Alaska has the fewest public charging ports, with 206, followed by North Dakota (279), South Dakota (326), Wyoming (329) and Montana (477).
Which state has the best EV charging coverage per electric car?
On ports per vehicle, Wyoming and North Dakota rank best, but mainly because their EV fleets are very small. Among states with large fleets, Massachusetts and New York offer the most public charging per car, at about 15 plug-in vehicles per port.
How many electric cars are registered in the United States?
7,454,800 plug-in vehicles were registered in 2025: 5,689,100 battery-electric and 1,765,700 plug-in hybrids, up 23.7% from 2024.
Which states are growing EV adoption fastest?
Among states with reliable counts, Michigan grew fastest in 2025, with battery-electric registrations up 48.5%. Delaware (44.1%), Alabama (39.4%) and Kentucky (38.0%) followed.
The global EV maintenance market: what the forecasts actually say
Forecasts for the global EV maintenance market in 2030 range from $26bn to $194bn. What each one counts, why they diverge, and which number to plan with.
GCC automotive aftermarket: where the EV money actually is
The GCC automotive aftermarket is US$10.7bn and grows with the car parc, under 2% a year. Only the EV slice compounds, and incumbents cannot service it.
EV Charging Stations by Country 2026: Global Ranking
China has 4.68 million of the world's 6.97 million public EV chargers. See 25 countries ranked by chargers, fast chargers and EVs per charger for 2026.